
Carbon Allocation
Memphis Light, Gas & Water Division appreciates our business relationship with you, and we are pleased to provide carbon data and opportunities which may allow further reduction of your organization’s carbon footprint.
Through 2024, MLGW’s power supplier, the Tennessee Valley Authority (TVA), has reduced carbon emissions by nearly 50%, compared to a 2005 baseline. Further plans are included in the regional 2024 Valley Pathways Study, which outlined avenues to achieve a net-zero greenhouse gas emission economy by 2050, and TVA’s draft 2025 Integrated Resource Plan. Today, the electricity that TVA delivers to MLGW for distribution to local customers is nearly 60% carbon-free through its nuclear fleet, hydroelectric dams and other renewable sources.
General Power Customer and TVA system Carbon Data:
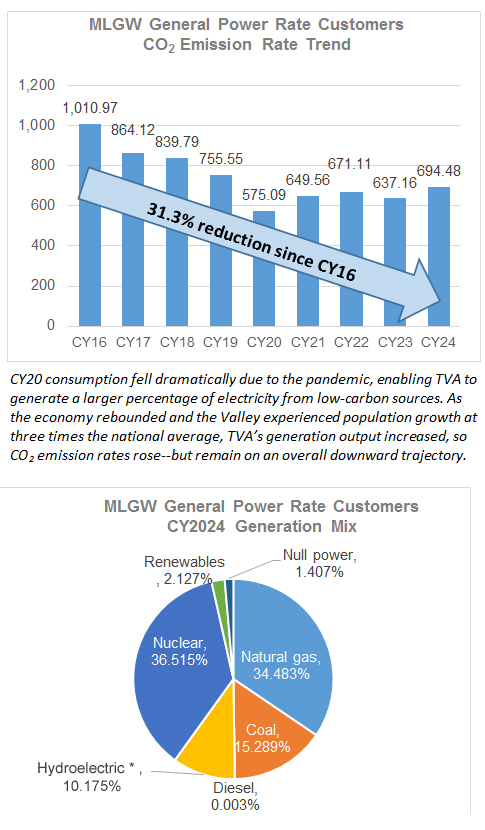
For customers consuming electricity under the General Power Rate, shown as “E2” on your MLGW bill and the “GSA” rate online, the CY2024 CO2 emission rate average for MLGW electricity purchases is 694.48 lbs/MWh. The CO2 rates disclosed reflect TVA’s CY2024 renewable energy credit adjustment, which resulted in a reduction of 3.27% in the as-delivered CO2 lbs/MWh rate. Consistent with generally accepted carbon accounting standards and in response to customer requests, actual CO2 emissions have been annually allocated to customers in the same manner as costs.
TVA’s 2024 system-wide carbon emission rate of 679.84 CO2 lbs/MWh is 24% below the current EPA eGRID regional average of 895.69 CO2 lbs/MWh and 12% below the EPA eGRID national average of 771.52 lbs/MWh. Your organization will benefit from using the CO2 emission rate associated with your MLGW electricity purchases, rather than the current eGRID data, for Scope 2 carbon reporting.
These CO2 emission rates, as well as the rates for other regions of the United States, can be found on the EPA website.
General Mix Data:
This CY2024 CO2 lbs/MWh rate includes emissions and generation from TVA-owned and -purchased power. TVA does not create or transfer Renewable Energy Certificates (RECs) from any of its hydroelectric sources. Therefore, consistent with CDP guidance, the Hydroelectric * energy percentage disclosed in this factsheet also can be reported as renewable to CDP. This as-delivered aggregated generation was comprised of the resource mix shown in the pie chart above. The Renewables segment included 1.697% wind, 0.218% solar, 0.000% biomass, 0.049% biogas and 0.162% landfill gas, while Null Power included RECs-encumbered renewable sources that have not been retired to the generation mix or sold.
Statement of Self-Certification:
In partnership with TVA, MLGW provides as-delivered CO2 emission rates to its customers in a manner consistent with generally accepted carbon accounting standards, such as: The Climate Registry’s Electric Power Sector Protocol for the Voluntary Reporting Program, the new World Resources Institute (WRI) and World Business Council for Sustainable Development’s (WBCSD) Greenhouse Gas Protocol’s Scope 2 Guidance. These standards are now routinely used to disclose GHG emissions in corporate reports, SEC filings, and to public disclosure organizations such as CDP, The Climate Registry (TCR), EcoVadis, or the S&P Dow Jones Sustainability Index .
Note: Your company’s greenhouse gas accounting situation may still require you to quantify your Scope 2 CO2e emissions associated with electricity use. You will still need to calculate CH4 and N2O, as the above data is for CO2 only. Corporate emission factors for CH4 and N2O can vary. TVA prevents double-counting customer-owned RECs by excluding them from its generation (residual) mix. Only TVA-owned RECs retired to the generation mix are reflected in the calculated CO2 rate provided here.
Your Organization’s Climate Profile Opportunities:
Thousands of companies around the world report their greenhouse gas (GHG) emissions and energy consumption. Institutional investors use the resulting disclosures to help reveal risk in their investment portfolios. In its 2024 CDP Supply Chain Report, over 340 CDP supply chain members—representing $6.4 trillion in purchasing power—requested disclosures from companies in their supply chains. On behalf of these members, CDP analyzed the disclosures to identify buyer practices that correlate with the most significant supplier actions.
A competitive carbon footprint can translate into increased sales or facility investments. If your company has GHG performance goals and/or participates in public disclosure of its GHG inventory, the availability of lower facility-specific CO2 lbs/MWh may improve your competitiveness.
The following are opportunities to consider:
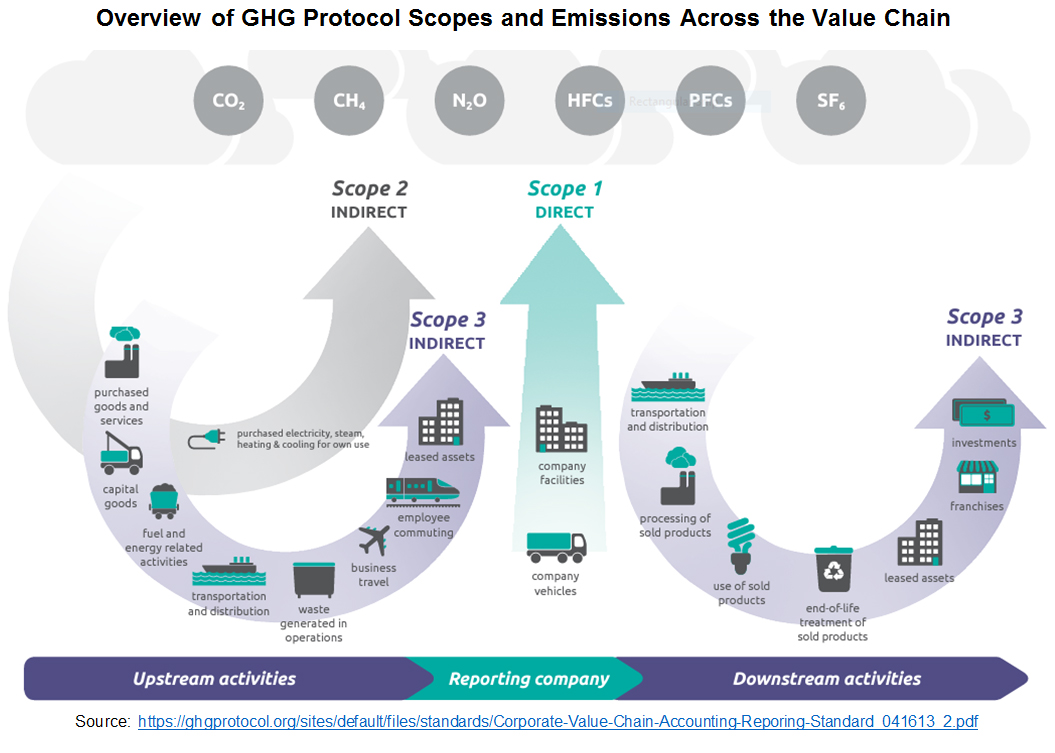
- Electrification: Increase electrification to potentially decrease direct CO2 (Scope 1) emissions associated with heating and non-electrical processes, plus fleet vehicle emissions. Contact MLGW early in the process if your organization is considering or already planning facility, process or fleet electrification projects.
- Energy Management: Discover the benefits of taking a systematic approach for reducing energy consumption and improving process efficiency across your organization through this on-demand video series. Also, shift as much energy usage as practical from system peaks (which are met by generation with higher carbon emissions) to system valleys (where generation has lower carbon emissions). Consider participation in Demand Response programs to lower usage during system peaks, which vary by season. In cooling months, peaks generally occur between 1:00 p.m. and 7:00 p.m. Central while heating months see peaks between 4:00 a.m. and 10:00 a.m. Central.
- Energy Efficiency and Conservation: Decrease indirect CO2 (Scope 2) emissions associated with purchased electricity, steam, heating and cooling use by implementing energy efficiency and conservation measures. Many energy efficiency upgrades qualify for EnergyRight incentives, federal tax incentives, and/or innovative financing through the Energy Efficiency and Renewable Energy Loan program or, for commercial properties located inside the City of Memphis, the Commercial Property Assessed Clean Energy and Resilience (C-PACER) program.
- Renewable Energy: Decrease indirect CO2 (Scope 2) emissions through onsite renewable generation or the purchase of Renewable Energy Certificates (RECs). Learn about renewable energy options offered by MLGW and TVA. See links to potential financing options for onsite generation in the bullet above.
Carbon risk management strategies are company-specific and dependent on GHG accounting scope. MLGW and TVA representatives will be pleased to assist you in reviewing your CO2 reduction options, exploring energy efficiency opportunities and discussing renewable energy options.
To request assistance, call the MLGW Business Solutions Center at 901-528-4270 or email MLGWbsc@mlgw.org
Memphis, TN 38103